About
Video Tutorial
About DRscDB:
DRscDB is a user-friendly, manually curated single-cell RNA-seq (scRNA-seq) search database based on datasets derived from published literature. DRscDB allows users to search, mine, and compare multiple genes and cell clusters across diverse species including Drosophila and Humans. DRscDB serves as a comprehensive repository of published scRNA-seq datasets that are manually curated, thus providing the users with literature-derived marker genes of various scRNA-seq datasets. Importantly, DRscDB has the power to identify gene orthologs across various species and allows for an efficient comparison of gene expression profiles at single-cell level. Salient features of DRscDB include but not limited:
- Mining scRNA-seq expression data for the gene of interest as well as the orthologous genes (use case 1).
- Gene Set of cell marker enrichment tool to find out the most enriched tissue and cell type for the input gene list (use case 2)
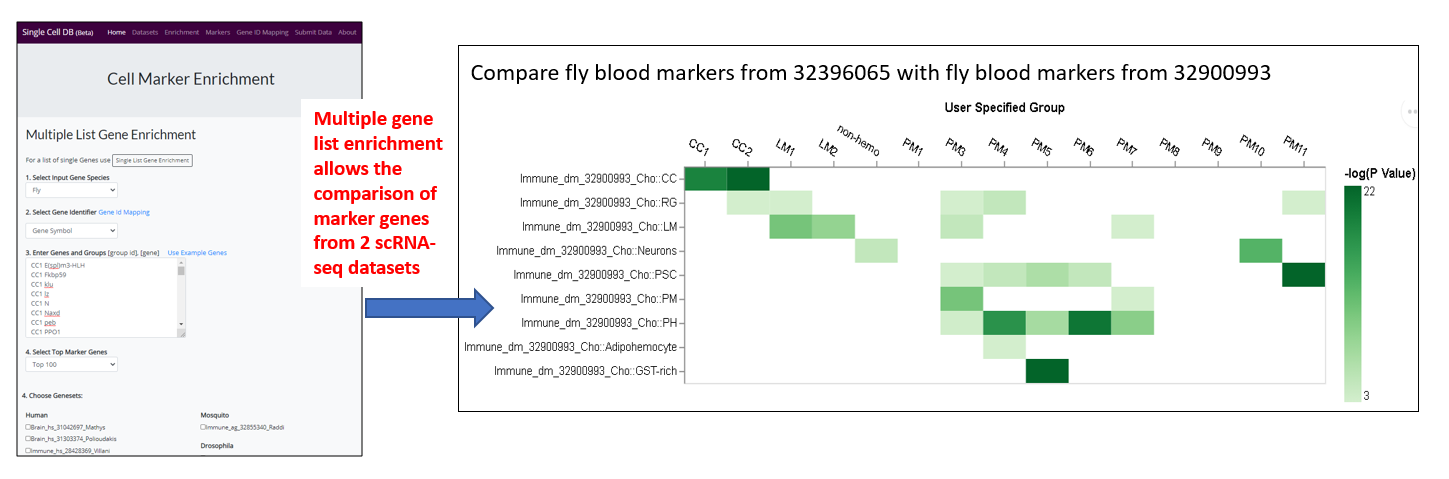
- Compare the marker genes across datasets, for example, compare the marker genes of newly obtained scRNA-seq dataset with related dataset for cell type assignment (use case 3)
- Cross-species comparison of gene expression profiles (use case 1, 2 and 3)
- Literature-derived marker genes pertaining to various single-cell clusters
- Gene ID mapping tool to synchronize gene identifiers
- Support community annotation of uncovered publications. We welcome community annotation and please submit the annotation files online to help expand the database coverage
Feedback can be sent to drsc@genetics.med.harvard.edu or using “software bug report form” at bottom of DRSC/TRiP home page .
Use Case 1 - Single Gene Search
1.) Landing page
- User needs to specify the species of input gene and DRscDB covers Drosophila, human, mouse and zebrafish
- User has the option to select the data by tissue
- User has the option to set the criteria of ortholog mapping. Ortholog mapping is based on DIOPT .
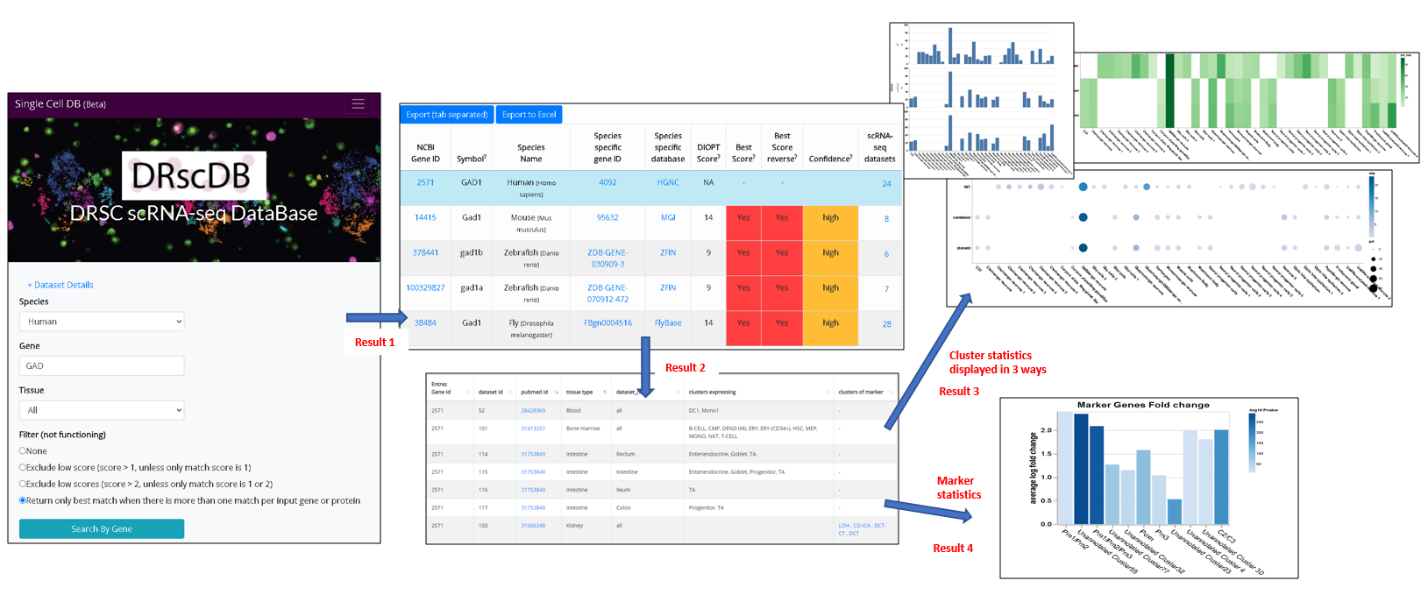
2.) Result page1
- This result page summarizes the number of relevant datasets expressing the input gene and orthologous genes. The input gene is highlighted in blue.
- User has the option to adjust ortholog mapping criteria at this page.
- User can select any gene from the summary table and click to view the result
3.) Result page2
- This result page summarizes the detailed information of relevant datasets for the selected gene and displays the information of pubmed ID, dataset name, tissue and cell types as well as marker annotation in a table format
- The table can be searched, sorted and exported
- User has the option to view the statistics for the expression at cluster level or marker annotation
4.) Result page3 (cluster level statistics)
- User has the option to view 3 different visualization: dot plot, bar graph and heatmap
- Default is dot plot and the size of the dots represents the percent cell expressing the input gene while the darkness of the dots reflects the average expression level.
- A table of cluster level statistics is provided at the bottom that is searchable, sortable and exportable.
5.) Result page4 (marker gene statistics)
- Statistics of marker genes is visualized by bar graph with the height reflecting fold enrichment while the darkness reflects -log10 P value.
- A table of marker statistics is provided at the bottom that is searchable, sortable and exportable
Use Case 2 – Single Gene List Enrichment
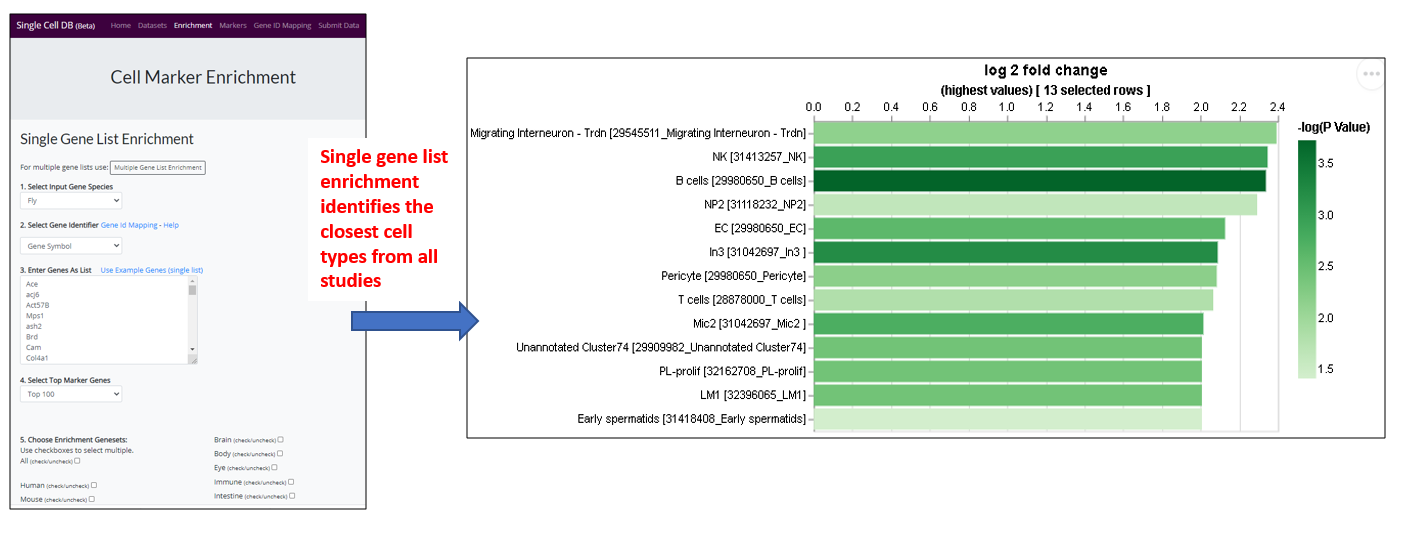
1.) Landing page
- User can analyze a list of any genes (eg. hits from cell-based screen, or a list of transcription factors) to find out the tissue/cell type that are enriched for. For example, this enrichment analysis will help user to identify the most relevant tissue/cell type if input a list of hits from a cell-based screen (eg. fitness genes), which allows the user to design the in vivo experiment accordingly as the next step. User might also use a list of specific gene group eg transcription factors (TFs) to identify the TFs that are expressing in the tissue/cell type of interest for follow up study.
- The species and type of gene identifier of input genes need to be specified. Gene identifiers can be official gene symbol, entrez geneid or species-specific gene id (eg. FBgn for Drosophila genes and MGI_ID for mouse genes).
Information about specie specific gene identifier
| Species id | Species name | Short name | Common name | Species specific database | Example of species specific ID | Website |
|---|---|---|---|---|---|---|
| 7165 | Anopheles gambiae | ag | Mosquito | vectorBase | AGAP012829 | https://vectorbase.org/ |
| 7227 | Drosophila melanogaster | dm | Fly | FlyBase | FBgn0260768 | https://flybase.org/ |
| 7955 | Danio rerio | dr | Zebrafish | ZFIN | ZDB-GENE-010525-1 | https://zfin.org/ |
| 9606 | Homo sapiens | hs | Human | HGNC | 10604 | https://www.genenames.org/ |
| 10090 | Mus musculus | mm | Mouse | MGI | 1196256 | https://www.informatics.jax.org/ |